Al hacer clic en «Aceptar todas las cookies», acepta el almacenamiento de cookies en su dispositivo para mejorar la navegación del sitio, analizar el uso del sitio y ayudar en nuestras iniciativas de marketing. Consulte nuestra Política de privacidad para obtener más información.
predictive analytics

Predictive Analytics for Renewable Energy Portfolios

Our models flagged a failure 299 days before a turbine would have been taken offline. How much notice does your system give you?

Most monitoring tools are a rear-view mirror. They show you what happened, in real time, after it happened. Predictive analytics is the windshield. It reads the same SCADA data you already collect and tells you what is coming, while there is still time to act.
automatic reporting
Con la confianza de los principales productores de energía mundiales
Renova logo with blue text and a circled R symbol.
Finlight logo with stylized F icon in orange gradient on black background.
DOST Enerji logo with blue text and a green kite graphic above the letter t.
Renova logo with blue text and a circled R symbol.
Finlight logo with stylized F icon in orange gradient on black background.
DOST Enerji logo with blue text and a green kite graphic above the letter t.
Renova logo with blue text and a circled R symbol.
Finlight logo with stylized F icon in orange gradient on black background.
DOST Enerji logo with blue text and a green kite graphic above the letter t.
Con la confianza de los principales productores de energía mundiales
Renova logo with blue text and a circled R symbol.
Finlight logo with stylized F icon in orange gradient on black background.
DOST Enerji logo with blue text and a green kite graphic above the letter t.
Renova logo with blue text and a circled R symbol.
Finlight logo with stylized F icon in orange gradient on black background.
DOST Enerji logo with blue text and a green kite graphic above the letter t.
Renova logo with blue text and a circled R symbol.
Finlight logo with stylized F icon in orange gradient on black background.
DOST Enerji logo with blue text and a green kite graphic above the letter t.
reserve una demostración

Experimente de Primera Mano la Diferencia Delfos

A few honest questions.

Ask yourself:
Do your alarms warn you before a failure, or just confirm one?
Do you know what you should have generated this week, not only what you did?
When an intervention is recommended, can you check it against your own analysis?
Would you catch a turbine quietly underperforming, or only see it in the monthly report?
If the answer is no:
Failures reach you as breakdowns, not warnings
Lost energy you never put a number on
O&M quotes you approve on trust
Underperformance you notice a month too late

The signals were already in your data. Nothing was reading them.

The solution

From Data You Already Have to Decisions You Can Act On

You do not need more sensors. You need something reading the data you already collect and telling you what it means before it costs you. On top of a single source of truth across every SCADA and OEM platform, Delfos:

Detects anomalies weeks to months before they become failures
Predicts component degradation while there is still time to plan
Compares real output against theoretical models and P50
Puts a number on the energy and revenue at risk
Book a demo

Failure Prediction & Anomaly Detection

Generic thresholds cry wolf. They flag every cold morning and every curtailment, and your team learns to tune them out. We build over 100 models tuned to your specific fleet, across 10+ turbine manufacturers, so a flag means something. Each one is ranked by the energy and revenue actually at stake, so you fix the failure that costs you, not the one that shouts loudest.
Early indicators we catch, across technologies:
Wind turbine subsystem deviations (pitch, yaw, gearbox, generator)
Inverter degradation patterns
Solar tracker performance anomalies
Battery degradation signals in BESS
Impact stat: predicts gearbox, inverter and battery faults around 30 days ahead of failure, across wind, solar and BESS

Theoretical vs Real Performance

Do You Know What This Asset Should Be Producing Right Now?

"Availability looks fine" is not the same as "we are capturing every megawatt-hour we could." A turbine can be online and still bleeding energy through a drifting pitch angle or a tiring generator. We model what each asset should produce under current conditions and track the gap against real output continuously, through Performance Ratio, an Energy Performance Index and performance heatmaps, benchmarked to P50 and aligned to IEC methodology. Quiet underperformance stops hiding inside a green dashboard.
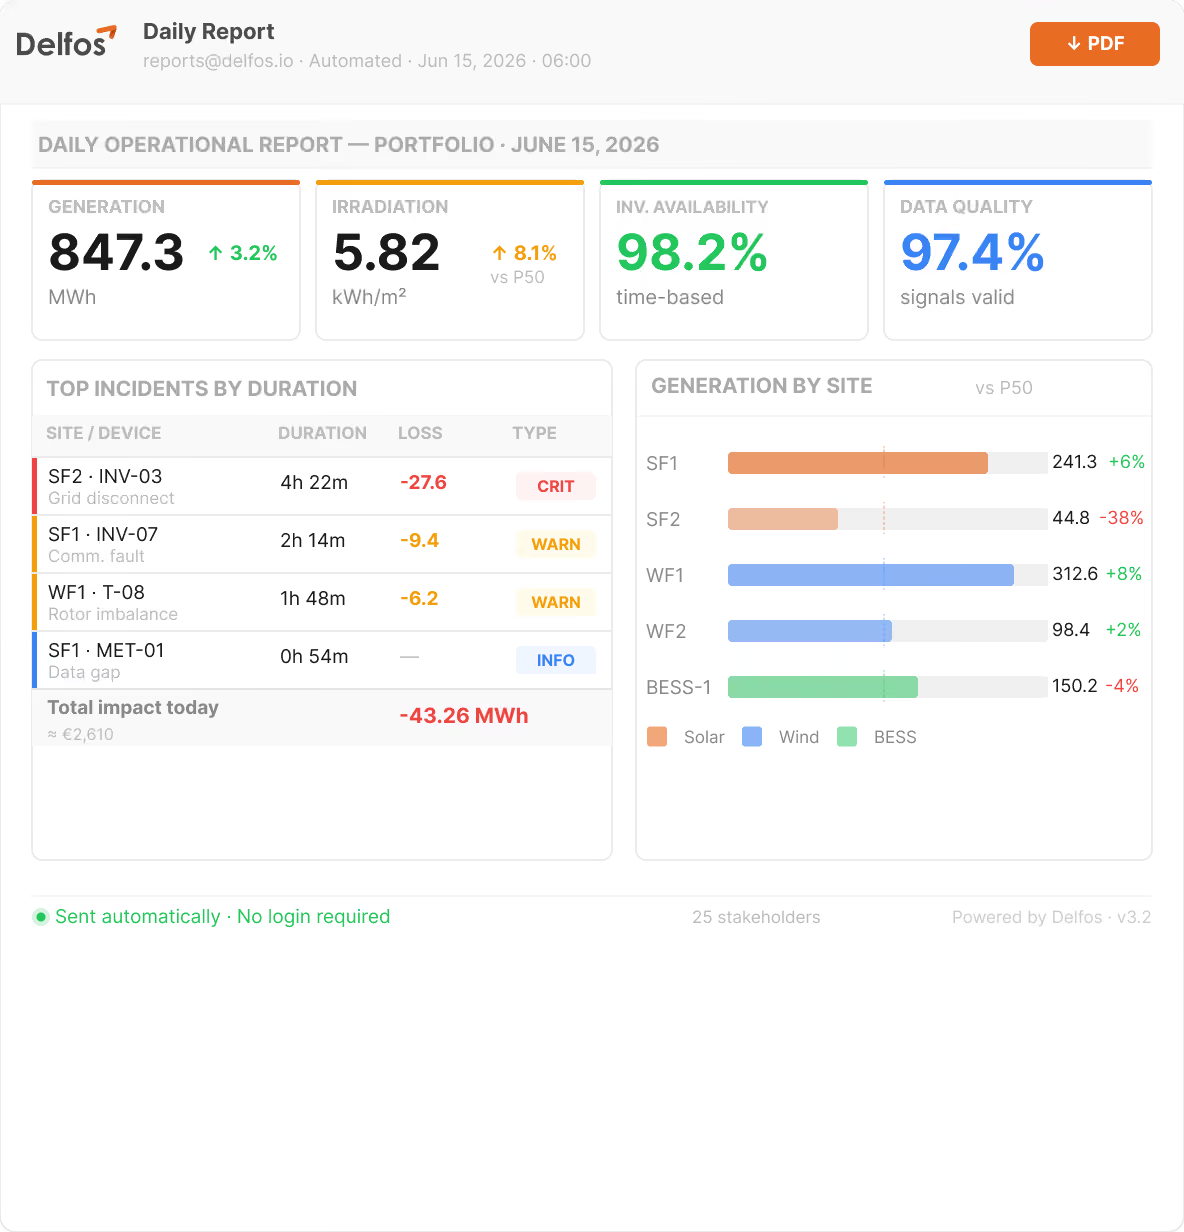
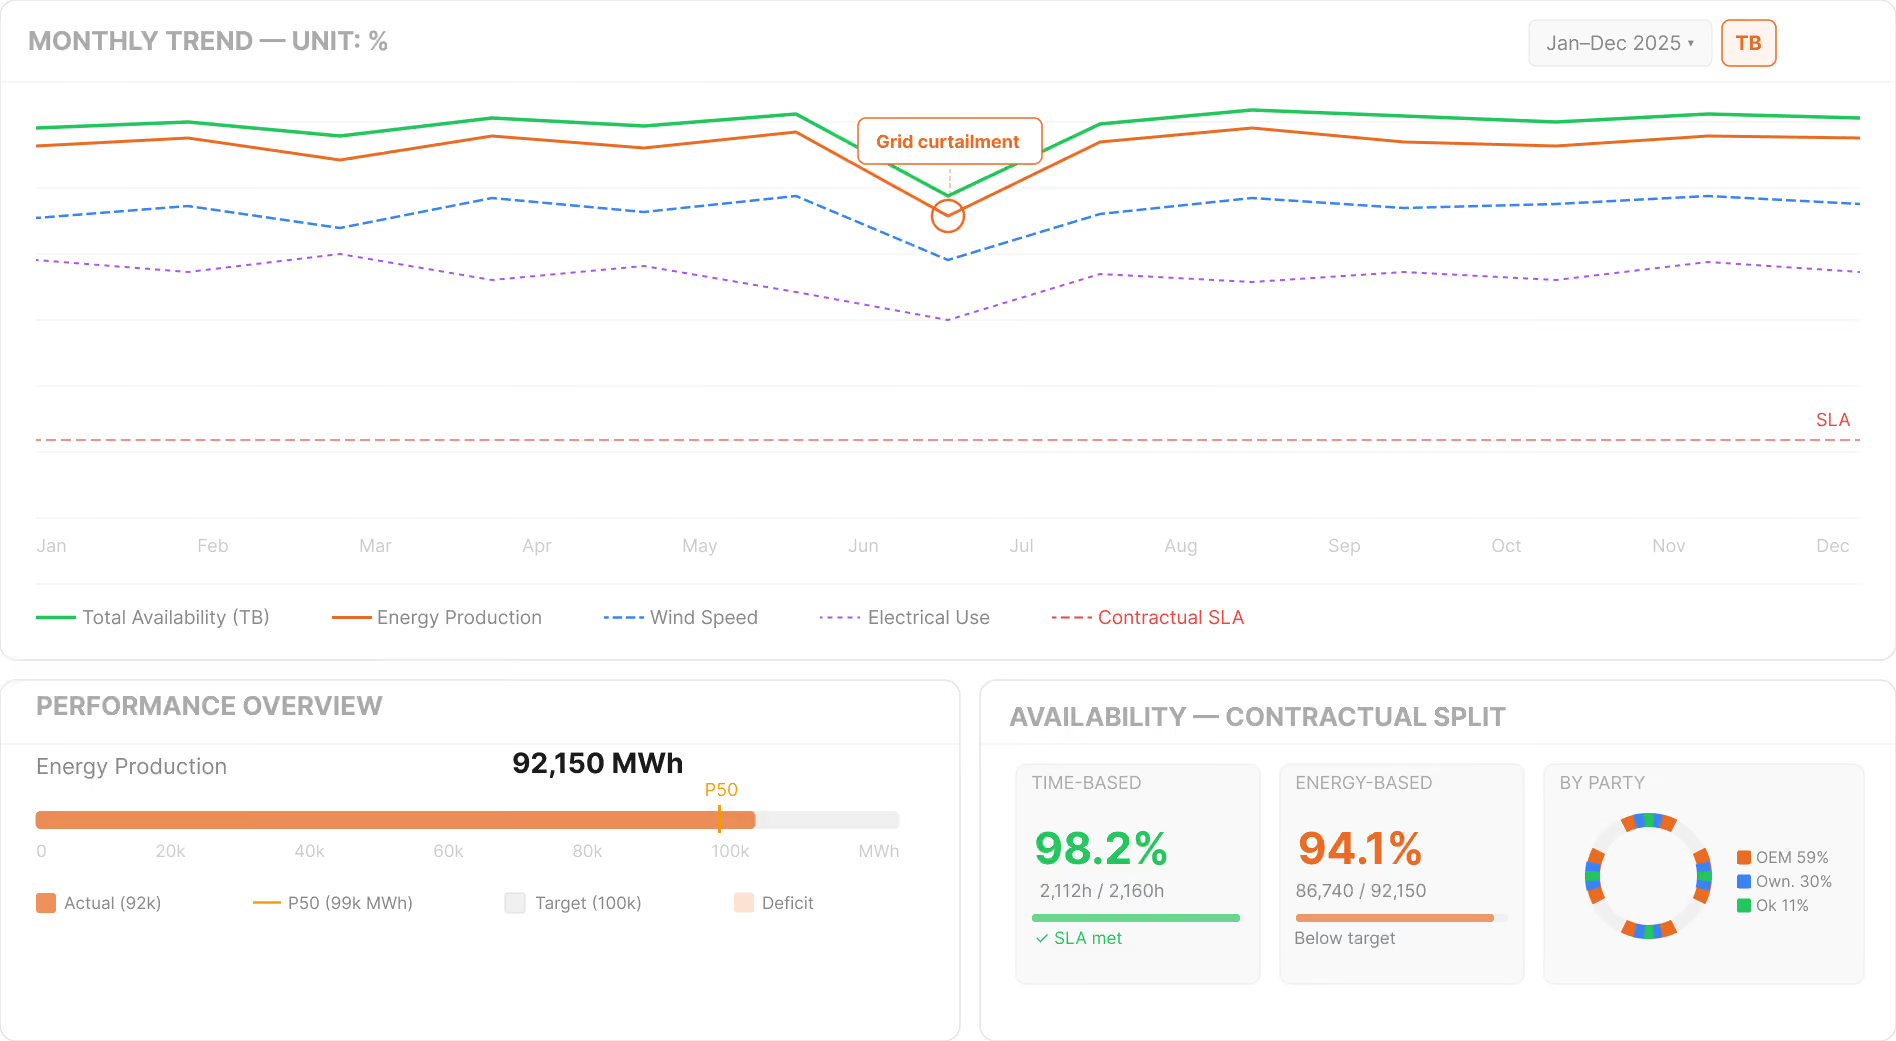
Impact stat: early detection on a yaw system fault protected 7,778 MWh over 299 days on one turbine

Audit Your O&M Providers

When Your O&M Provider Recommends an Intervention, Can You Check the Math?

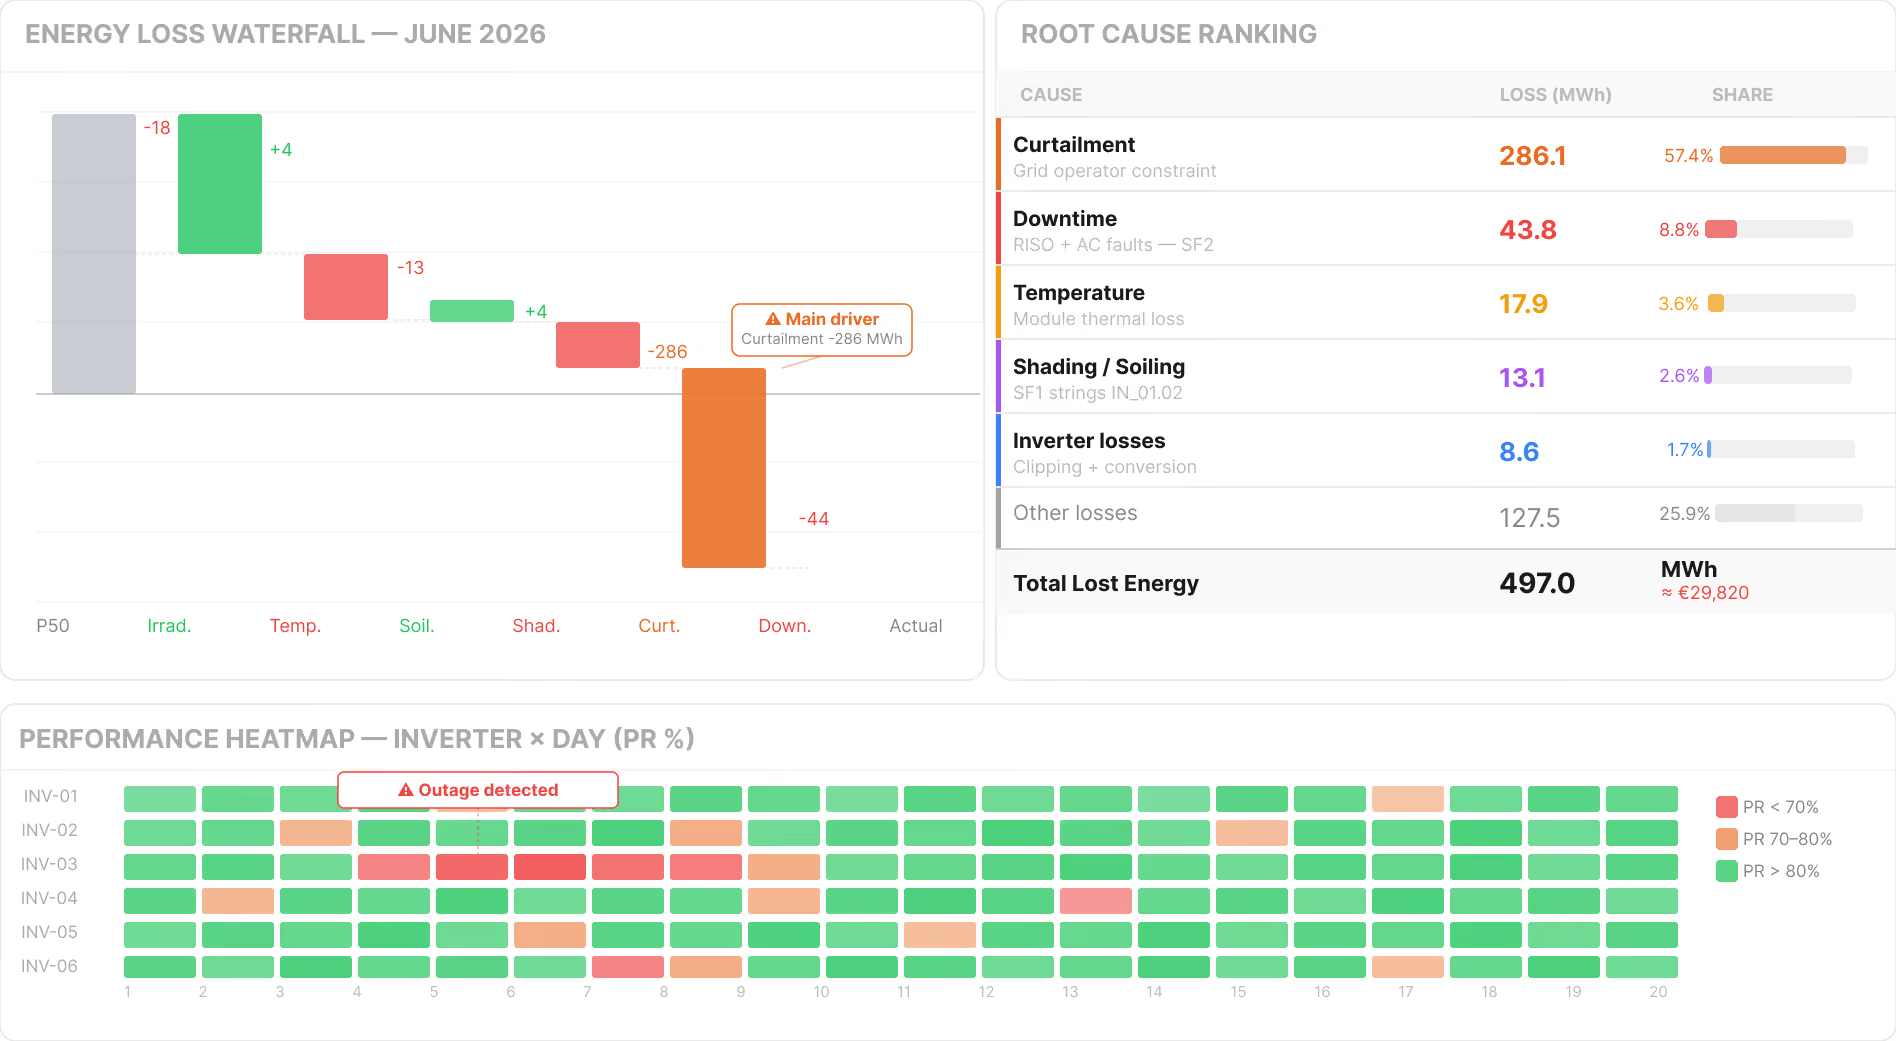
Most operators cannot, so they pay for it. Without independent analysis, the party doing the work is also the party grading it. We give you your own root cause analysis, ranked by duration and revenue impact, plus availability you track yourself. That turns "trust us" into a conversation you can have on equal footing, with the data on your side.

Impact stat: unavailability fell from 9 to 12% down to 1 to 2%

Reliability & Maintenance Analytics

Is Your Maintenance Plan Built on Data, or on Habit?
Most maintenance calendars are inherited, not calculated. Nobody quite remembers why a component gets serviced on the schedule it does, only that it always has been. We give you the reliability numbers to replace habit with evidence: how often each component actually fails, how long it takes to bring back, and which failures dominate your downtime. Then you plan around what the fleet is really doing, not what a manual assumed years ago.
Reliability analyses include:
Mean Time Between Failures (MTBF) and Mean Time to Failure (MTTF)
Mean Time to Repair (MTTR)
Failure Pareto, so you tackle the few causes behind most of your losses

Impact: maintenance decisions driven by evidence, not assumptions, so planned work replaces unplanned outages.
From Reactive to Proactive Maintenance

Prediction Only Pays Off If It Changes What You Do on Monday.
A forecast that sits in a report changes nothing. We turn predictions into a prioritized plan: which asset, which component, how much revenue is on the line, and how long you have to act. Repairs get scheduled instead of forced, and the losses that used to hide between reporting cycles get recovered.

Impact stat: 10% revenue recovered from previously hidden energy losses

WHY IT MATTERS AT SCALE

The bigger the fleet, the more a missed signal costs.

More assets and more OEMs, each with its own definition of "normal"
More signals, and far more noise
Alarm fatigue that buries the warnings that matter
Small deviations that compound into major losses when no one is forecasting them

One turbine caught early protected 7,778 MWh. Multiply that across a growing portfolio, and prediction stops being a nice-to-have.

respaldado por números

Principales Métricas y Logros

Across real deployments

299 days of advance warning on a single turbine

224 wind turbine shutdowns avoided

7,778 MWh protected from one early detection

9 to 12% down to 1 to 2% unavailability

18% downtime reduction (V2i Energia)

10% revenue recovered from hidden energy losses

Asset Performance Manager

You want to see the failure coming and know what the asset should be producing, not refresh a live dashboard and hope.

Head of Asset Management

You want a fleet that runs on forecasts, not fire drills, with outcomes you can prove to the people above you.

Reliability / Data Analyst

You want models tuned to your actual turbines and inverters, not a generic benchmark that flags every windy afternoon.

CFO / Investment Funds

You want energy losses named and recovered, with numbers that hold up in front of investors.
contacta con nosotros

Soluciones Personalizadas de Energía Renovable

If your tools only report the past, if you cannot say what an asset should be producing right now, or if you take your O&M provider's word because you have no way to check it, you are leaving energy and revenue on the table. See predictive analytics run on your own portfolio.