Ao clicar em “Aceitar todos os cookies”, você concorda com o armazenamento de cookies em seu dispositivo para melhorar a navegação no site, analisar o uso do site e auxiliar em nossos esforços de marketing. Consulte nossa Política de Privacidade para obter mais informações.
PERFORMANCE ENGINEERING

Performance Engineering as a Service for Renewable Energy Portfolios

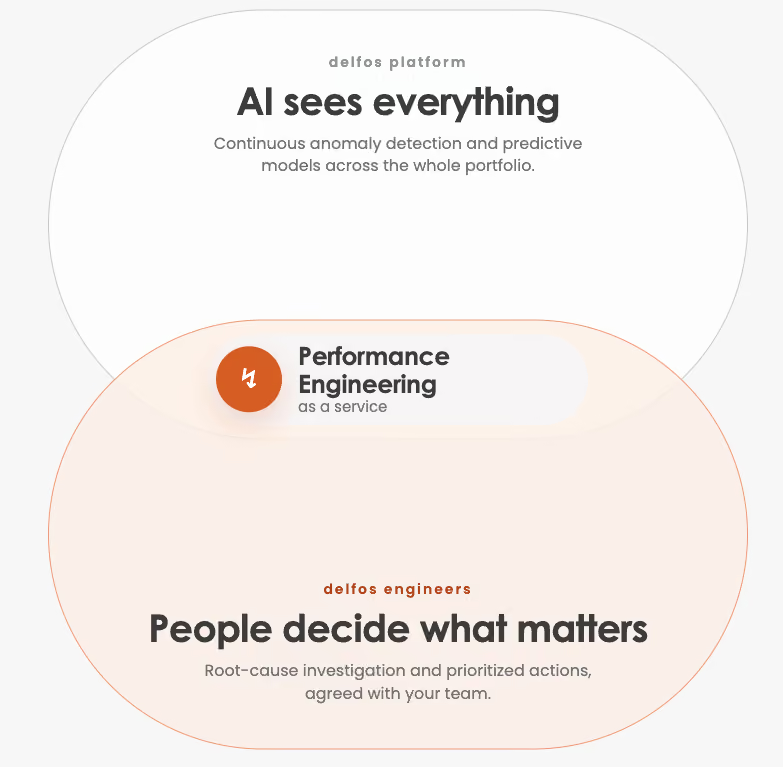
Root cause analysis, custom predictive models and a direct line to the team that builds them, on top of the Delfos platform.

A dedicated team of performance engineers working inside your data, not just delivering a dashboard, to turn alarms into root causes and root causes into a maintenance plan.
automatic reporting
Confiado pelos principais produtores globais de energia
Renova logo with blue text and a circled R symbol.
Finlight logo with stylized F icon in orange gradient on black background.
DOST Enerji logo with blue text and a green kite graphic above the letter t.
Renova logo with blue text and a circled R symbol.
Finlight logo with stylized F icon in orange gradient on black background.
DOST Enerji logo with blue text and a green kite graphic above the letter t.
Renova logo with blue text and a circled R symbol.
Finlight logo with stylized F icon in orange gradient on black background.
DOST Enerji logo with blue text and a green kite graphic above the letter t.
Confiado pelos principais produtores globais de energia
Renova logo with blue text and a circled R symbol.
Finlight logo with stylized F icon in orange gradient on black background.
DOST Enerji logo with blue text and a green kite graphic above the letter t.
Renova logo with blue text and a circled R symbol.
Finlight logo with stylized F icon in orange gradient on black background.
DOST Enerji logo with blue text and a green kite graphic above the letter t.
Renova logo with blue text and a circled R symbol.
Finlight logo with stylized F icon in orange gradient on black background.
DOST Enerji logo with blue text and a green kite graphic above the letter t.
agende uma demonstração

An Alert Is Not a Root Cause

Mid to large renewable operators typically manage:
Multiple SCADA systems and OEM platforms across the portfolio
More sites, more OEMs, more signals as the fleet scales
Alarm fatigue and fragmented context between monitoring and maintenance teams
Mid to large renewable operators typically experience:
Very slow support that impacts the business
Slow response and lengthy development cycles for requested improvements
Providers who don't take feedback
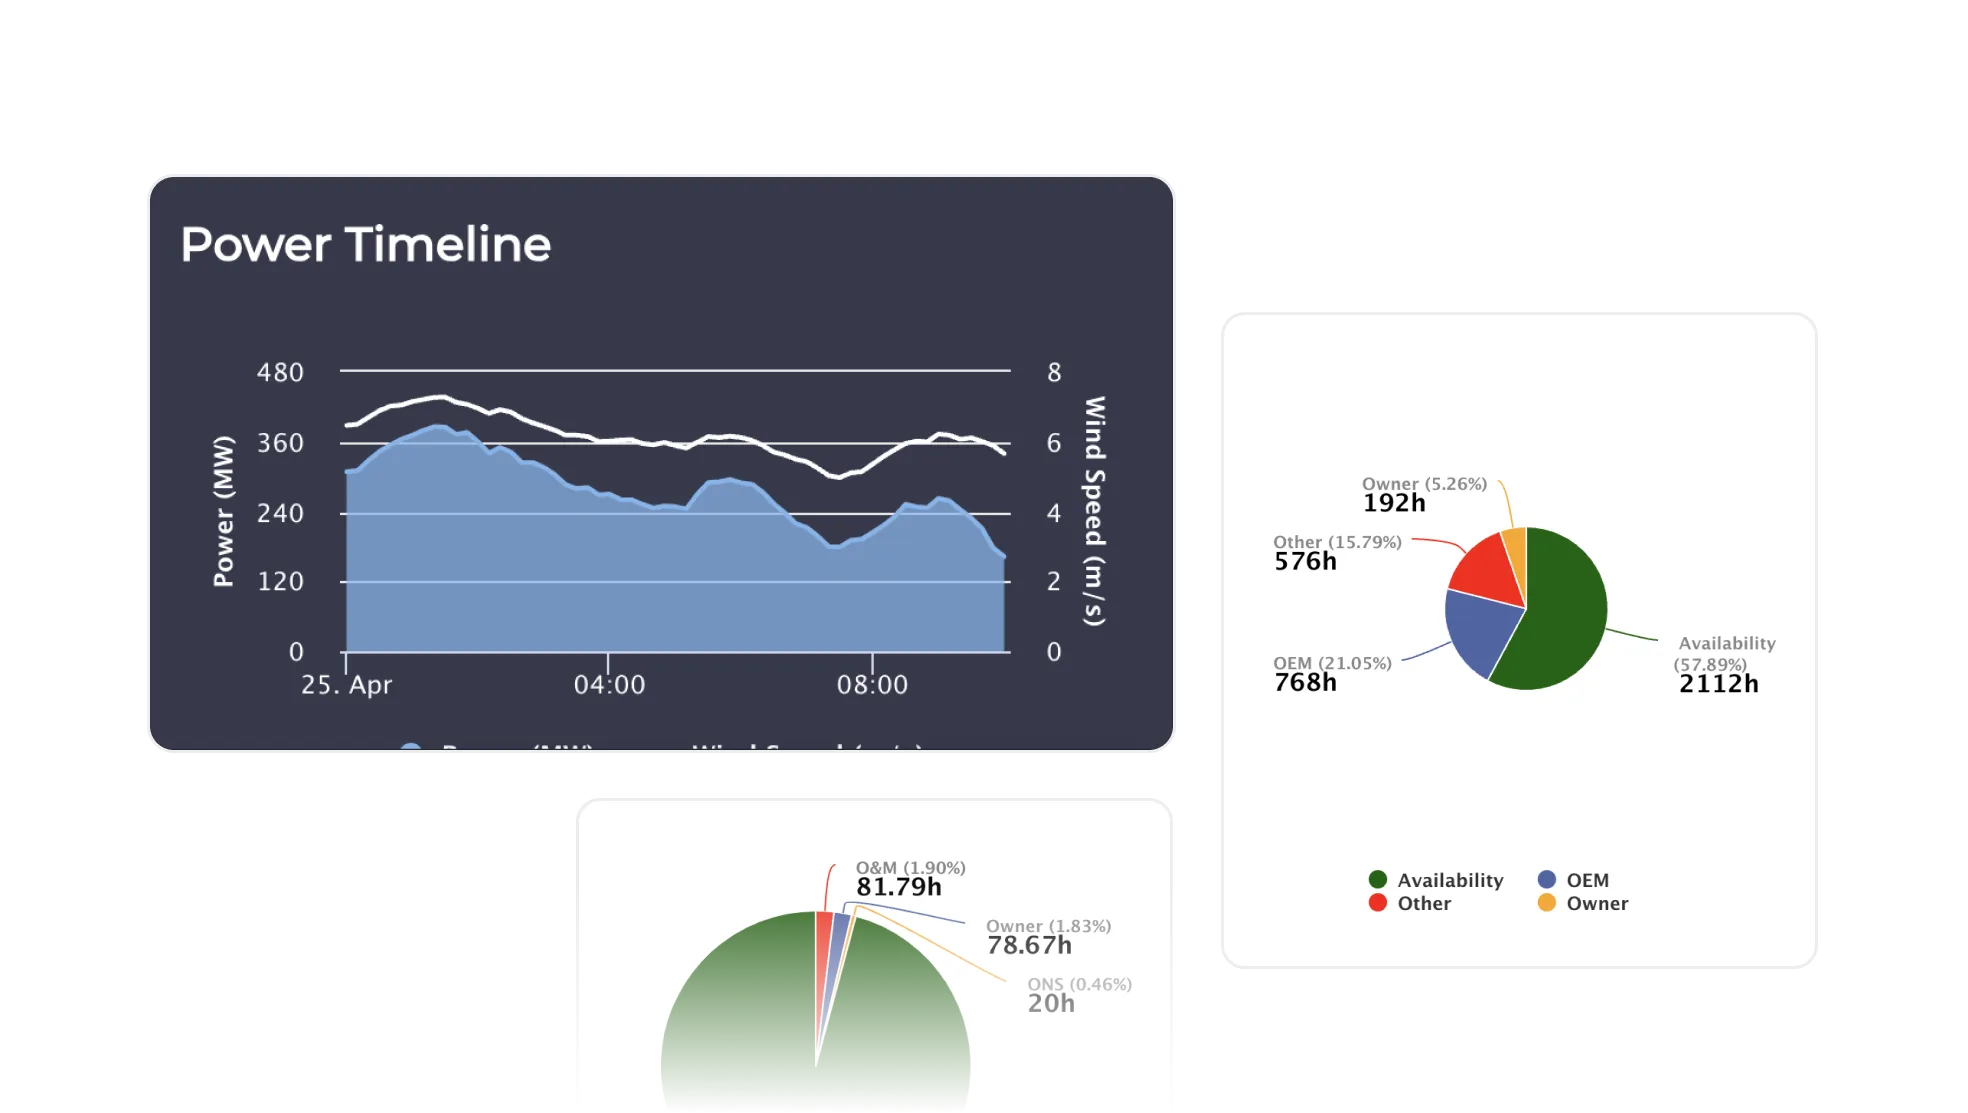
a pair of business cards with graphs on them
The solution

Look for a Partner, Not Just a Vendor

Once implementation is done, most operators are not looking for another tool. They are looking for a partner who stays involved after go live and helps them build the next thing, not just maintain the last one

"Delfos treated us like partners from day one. Their team feels like an extension of ours." — Finlight, Solar client
"Delfos has strong know how, a fast platform, quick responses, and a very eager team." — Dost Enerji, Wind client

Root Cause Investigation

Automated failure analyses include:
Root cause identification through temporal and spatial pattern analysis across neighboring turbines
Deviation detection comparing predicted versus actual behavior on key turbine variables
Ranking of main failure drivers by duration and revenue impact
Impact: clients avoided 224 wind turbine shutdowns using predictive anomaly detection 

Custom Predictive Models

Our engineering team builds and tunes models specific to your fleet:
Over 100 predictive models running across wind, solar, hydro and BESS
10+ wind turbine manufacturers integrated
Models evolve over time and can accommodate new failure modes as they appear

Impact: early detection on a yaw system fault avoided the loss of 7,778 MWh over 299 days on one turbine 

Benchmarking Against P50

Performance engineering includes:
Identifying which loss categories are deviating from the P50 expectation
Power curve and subsystem analysis, including pitch, generator and oil, to detect underperformance
KPI reporting aligned to IEC methodology for globally consistent numbers

Impact: downtime fall from 9 to 12 % down to 1 to 2 %

Dedicated Engineering Support

What comes with the service:
A named engineering contact, not a ticket queue
Feedback from your team feeds directly into model tuning and roadmap requests
Support scoped for both EU and US/LATAM operating hours

Impact: 20 to 30 % reduction in invoicing workload and 10 % revenue recovery from previously hidden energy losses

WHY IT MATTERS AT SCALE

As fleets scale, alarms multiply. Insight does not, unless someone is engineering it.

More sites, more OEMs
More signals, more noise
Alarm fatigue sets in
Insight needs engineering
apoiado por números

Principais Métricas de Desempenho e Conquistas

Across real deployments

9 to 12% down to 1 to 2% unavailability

20 to 30% reduction in invoicing workload

10% revenue recovered from hidden energy losses

50% reduction in monitoring time

3 to 4 hours saved per user per week

Operations Manager

wants faster root cause answers, not more alarms

Head of Asset Management

wants a partner accountable for outcomes across the fleet, not just uptime of a dashboard

Reliability / Data Analyst

wants models tuned to their actual turbines and panels, not a generic benchmark

CFO / Investment Funds

wants lost revenue quantified and recovered, with numbers that hold up to investors
entre em contato conosco

Soluções Personalizadas de Energia Renovável

If support has been slow and it's impacted your business, if requested improvements take lengthy development cycles, or if your provider doesn't take feedback, it might be time for a partner who does things differently.