By clicking “Accept all cookies”, you agree to the storing of cookies on your device to enhance site navigation, analyze site usage, and assist in our marketing efforts. View our Privacy Policy for more information.
Automatic reporting

Automatic Reporting for Renewable Energy Portfolios

Centralize your data. Standardize your KPIs. Automate your reports.

Eliminate manual reporting across SCADA and OEM platforms to deliver reliable, engineering-grade reports across wind, solar and BESS.

A women presenting some charts
Trusted by the main global energy producers
THE PROBLEM

Reports Should Be A Click Away

Mid to large renewable operators typically manage:
Multiple SCADA systems
5 to 10 OEM platforms
Different KPI methodologies across teams
Manual Excel-based monthly reporting
Delays in ESG and board reporting
Mid to large renewable operators typically manage:
Conflicting availability numbers
Time lost categorizing losses
Slow decision-making
Limited visibility across the portfolio
a pair of business cards with graphs on them
The solution
A women presenting some charts

What Automatic Reporting Means

Delfos centralizes all operational data in one unified platform.
From there, we:
Limited visibility across the portfolio
Monitor data quality automatically
Generate daily, weekly and monthly reports
Distribute reports automatically to stakeholders
Quantify availability and energy losses

Daily Operational Reports

Automated daily reports include:
Generation
Irradiation
Inverter availability
Top incidents by duration
Data quality indicators

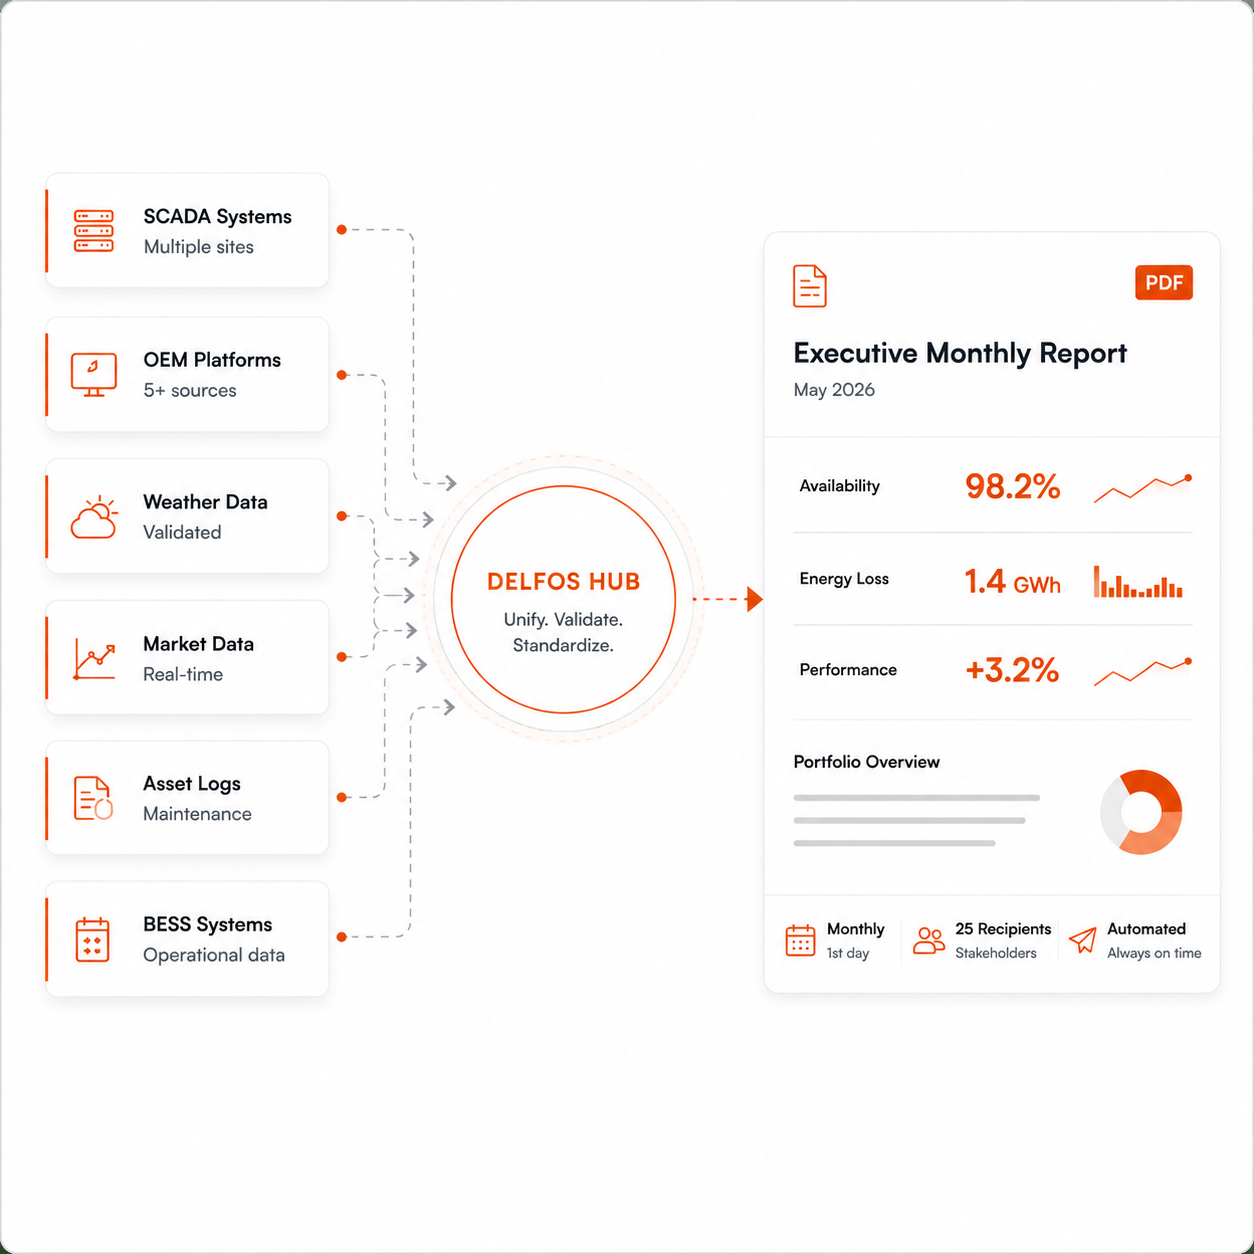
Reports are automatically sent to relevant stakeholders without requiring platform login.

Impact: Faster prioritization and operational clarity.

A women presenting some charts

Availability & Contractual Reporting

Automated calculation of:
Time-based availability
Energy-based availability
Contractual availability by the responsible party

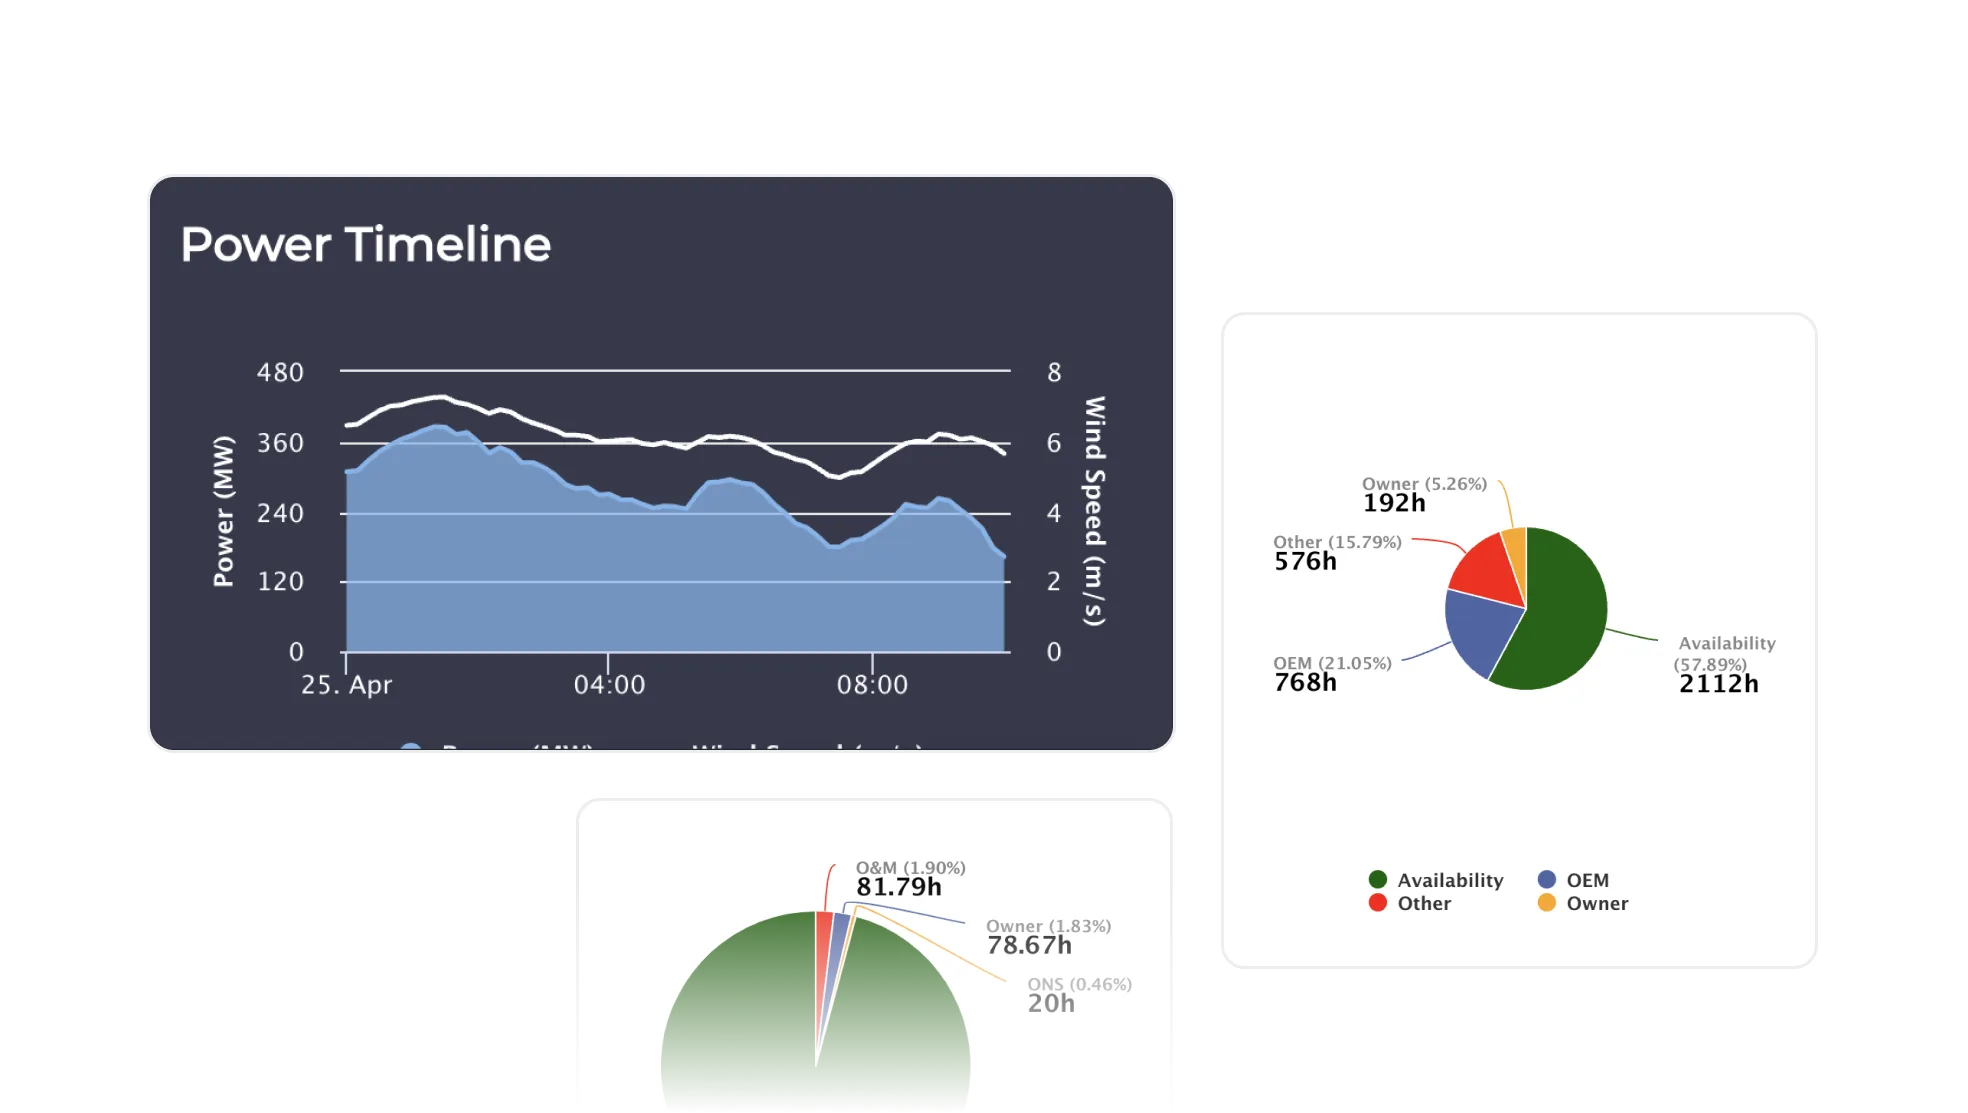
No manual downtime audits.
Clear financial exposure visibility.

Impact: Reliable numbers for executives and investors.

Energy Loss & Root Cause Reporting

Automated analyses include:
Lost energy in kWh
Pareto of main failure drivers
Performance heatmaps

Impact: Objective discussions with OEMs and faster root cause identification.

A women presenting some charts

Data Quality Monitoring

Data quality indicators are embedded in reporting.
This ensures:
Missing or inconsistent signals are flagged
KPIs are based on validated inputs
Teams work with the same methodology

Impact: Trust in numbers across operations and finance.

WHY IT MATTERS AT SCALE

As portfolios grow, complexity increases.

More assets
More OEM platforms
More regulatory requirements
More investor scrutiny
PROVEN IMPACT

Operational Results, Not Just Reports

Across real deployments

Reporting time reduced from 15 days to 2 days

Each user saves 2–3 hours per week, roughly 25% of their time, now reallocated to higher-value work

Data-driven maintenance prioritization

Reduced manual reporting workload

Improved financial visibility on availability and revenue losses

Operations Manager

Immediate clarity on what is underperforming today.
Daily automated insights without manual checks.

Head of Asset Management

Standardized KPIs across the portfolio.
Reliable data for strategic decisions and board reporting.

Data Analyst

Flexible visualizations and advanced analysis without rebuilding raw datasets.

CFO / Investment Funds

Clear financial impact of availability and downtime.
Confidence in portfolio-level reporting.

Receive the report directly in your inbox on time / flawless 
contact us

Move from Manual Reporting to Operational Intelligence

If your team is still exporting data to Excel, debating availability numbers, or spending hours consolidating reports, it is time to change the structure.

See how automatic reporting works on your portfolio.