Renewables Overtake Coal Globally for the First Time: A Landmark Shift in Power Generation

The first half of 2025 marked a profound milestone for the global power sector: renewables surpassed coal as the largest source of electricity for the first time in history. According to Ember’s Global Electricity Mid-Year Insights 2025, solar and wind power together generated 5,072 TWh, exceeding coal’s 4,896 TWh.
This historic achievement validates the long-term trajectory of clean energy and reinforces its role not as an alternative, but as the new backbone of the global power system.
1. Solar and Wind Now Outpace Fossil Growth
Between January and June 2025, global electricity demand increased by 2.6%, adding 369 TWh to the system. Solar energy alone absorbed 83% of this growth, contributing an unprecedented 306 TWh, a 31% year-over-year increase. Wind added 97 TWh, growing by 7.7%.
Together, these sources didn’t just meet the new demand—they replaced fossil generation, driving a net decline in coal and gas output.
Breakdown of Renewables' Share (H1 2025):
- Solar: 8.8% (up from 6.9%)
- Wind: 9.2%
- Hydro: 13.5%
- Bioenergy + Others: 2.8%
- Total Renewables: 34.3%
- Coal: 33.1%
This shift has global implications, not just for climate goals, but for how energy assets are managed, operated, and integrated.
2. Solar Drives the Surge: A Global Record
The surge in solar generation was geographically broad, though led by a few dominant players:
- China: +168 TWh (55% of global growth)
- United States: +44 TWh
- European Union: +37 TWh
- India: +17 TWh
- Brazil: +10 TWh
What’s striking is how solar has moved from niche to mainstream baseload in many countries. As of 2025, at least 29 countries generate more than 10% of their electricity from solar, compared to just 11 in 2021. This trend reinforces solar’s status as a mature and scalable technology.
Case in Point: Brazil
In Brazil, solar accounted for 10 TWh of the growth, supported by a rapidly expanding distributed generation (GD) market and strong solar irradiance. This rise strengthens Brazil's hybrid energy mix and highlights the potential for battery integration and predictive maintenance platforms to keep up with system complexity.
3. Coal and Gas Lose Ground, But Not Everywhere
Globally, fossil generation fell slightly (-0.3%), with coal down 0.6%. These declines were concentrated in fast-growing clean power economies:
- China avoided +46 MtCO₂ through solar and wind.
- India avoided +24 MtCO₂.
However, fossil generation rose in the United States (+4.3%) and European Union (+4.8%), due to weak hydro and wind performance and increased reliance on gas.
This regional divergence highlights a key insight: clean energy growth alone is not enough: reliability, storage, and grid flexibility must also scale.
4. Carbon Dioxide Emissions Flatline: A Climate Turning Point
Despite rising electricity demand, global CO₂ emissions from the power sector remained stable, even falling slightly (-12 MtCO₂). Without renewables’ growth, emissions would have increased by over 230 MtCO₂, equivalent to Africa’s entire power sector emissions for the same period.
This decoupling of demand from emissions is critical. It confirms that solar and wind can grow fast enough to meet demand without relying on fossil peakers, provided they are supported by robust grid infrastructure, forecasting systems, and storage solutions.
5. What This Means for Grid Operators and Energy Managers
The implications of this transition are substantial for COG Managers, Performance Engineers, and O&M Managers. As renewables take on a baseload role, asset complexity increases, and operational strategies must evolve.
Key Implications:
- Higher volumes of variable generation require precision in forecasting, curtailment management, and performance diagnostics.
- Asset health monitoring becomes critical to prevent losses and optimize uptime in distributed portfolios.
- Storage systems (BESS) must be integrated with real-time operational intelligence to manage intermittency effectively.
- Flexible ramping solutions (4–7 hours) will be needed, especially in grids with high solar penetration.
Managing this new era of high-penetration renewables requires tools capable of translating operational complexity into actionable intelligence. Advanced platforms must support predictive maintenance, real-time performance diagnostics, and strategic decision-making, enabling energy teams to scale clean power reliably and sustainably across diverse asset portfolios.
6. Regional Focus: China, US, EU, India, Brazil
Let’s explore how major economies are contributing to this shift:
China
- World’s largest solar and wind generator.
- +55% of global solar growth in H1 2025.
- Significant emissions savings via rapid clean deployment.
United States
- Solar added 44 TWh despite increased gas reliance.
- Grid stress from underperforming wind and hydro.
European Union
- Added 37 TWh solar; Germany, Spain, Netherlands led.
- Weak hydro and wind required fossil fallback, raising emissions.
India
- Clean energy growth outpaced demand.
- Achieved notable CO₂ emissions savings.
Brazil
- 10 TWh solar growth.
- Expanding hybridization (solar + hydro + BESS).
- Opportunities for asset intelligence tools to optimize O&M.
The Future Is Clean, But Complex
The rise of renewables is a victory, but it brings new challenges. As solar and wind become primary sources, managing them becomes more like managing traditional baseload, but with far more volatility and data.
Grid operators, energy asset managers, and plant operators now face an environment that demands:
- Advanced monitoring and diagnostics
- Predictive failure detection
- Data quality assurance
- Automated reporting to align with KPIs and SLAs
- Seamless integration of storage systems like BESS
Meeting the demands of a renewable-dominated grid calls for data infrastructure that is not only reactive but forward-looking. Scalable asset intelligence platforms play a critical role in unifying performance data, anticipating failure modes, and aligning operational priorities with long-term energy transition goals.
What Comes Next?
As we move into 2026, the trend is irreversible: clean power is now at the center of global electricity. But unlocking its full potential will require:
- Policy frameworks that accelerate storage, forecasting, and grid flexibility.
- Investment in digital infrastructure to support predictive asset management.
- Cross-sector coordination to reduce curtailment and improve dispatchability.
Your Next Step in a Clean Energy World
This global milestone affirms what energy stakeholders already sense: renewables are no longer the future, they are the present.
If you manage, operate, or optimize renewable energy assets, now is the time to evolve your operations with data-driven intelligence.
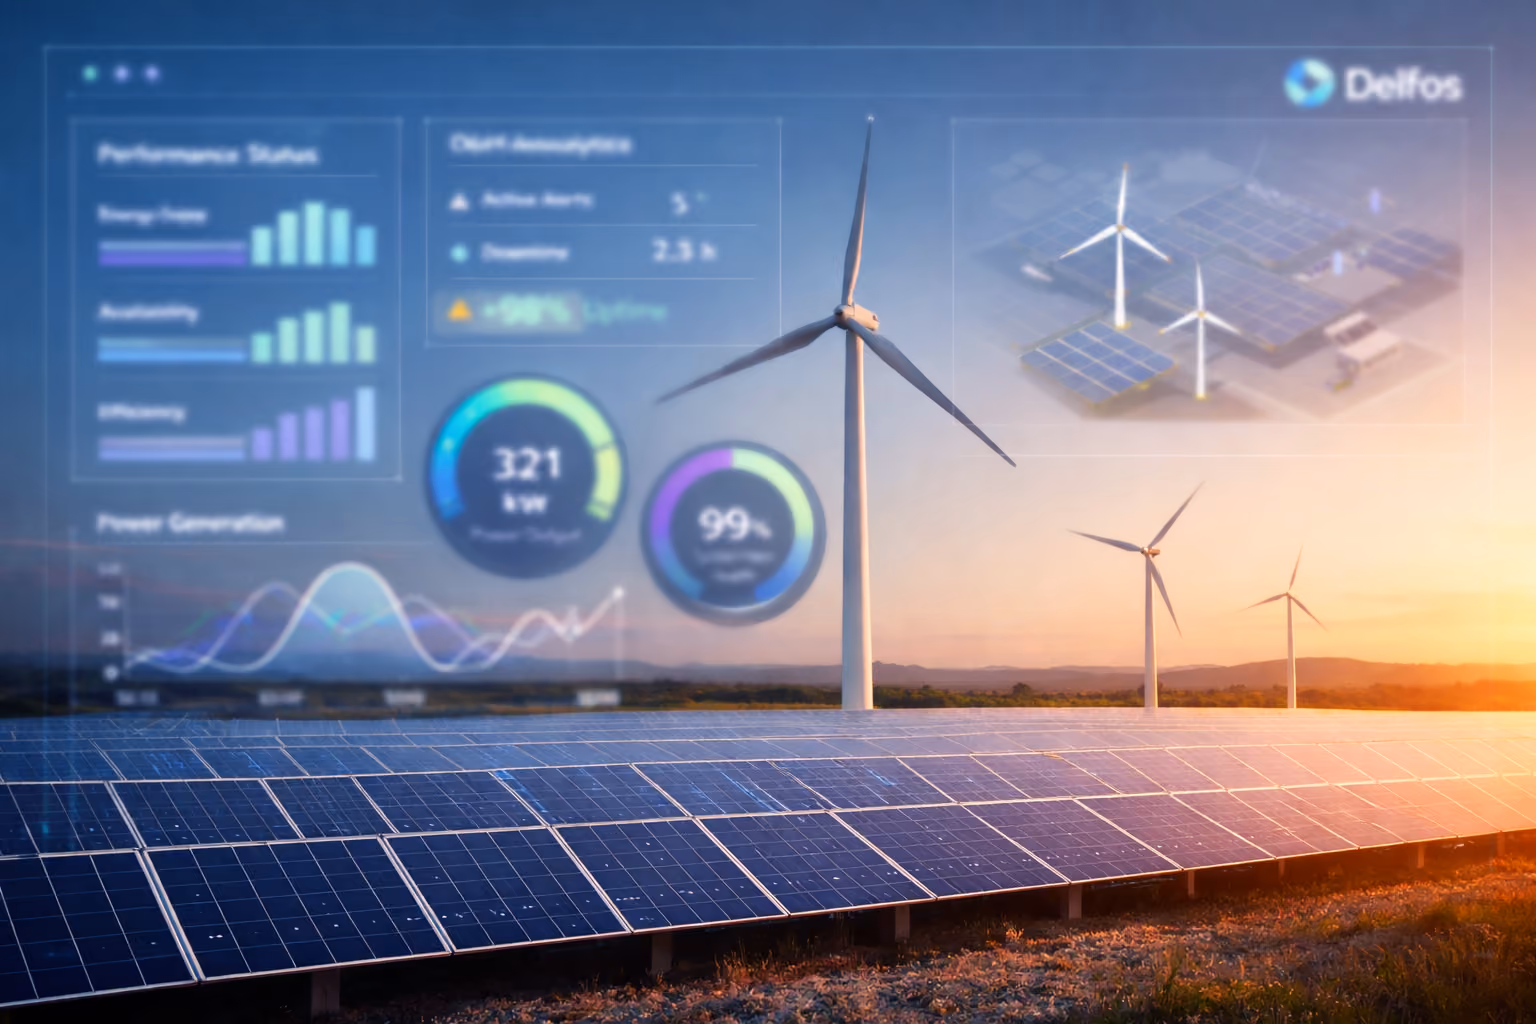
Book a demo with Delfos Energy and see how we help COG Managers, O&M teams, and performance engineers unlock maximum value from solar, wind, and storage assets.
Book a meeting
Let's connect and forge new partnerships
Custom Renewable Energy Solutions
Contact us today and join global operators who recovered up to 10% revenue and cut downtime by 18%