Geo Heatmap for Solar: Pinpointing PV Underperformance with Geospatial Intelligence
October 24, 2025
3 min

Geo Heatmap for Solar: Pinpointing PV Underperformance with Geospatial Intelligence

Discover how the Delfos Geo Heatmap turns performance data into a map‑based view, enabling faster fault detection and smarter O&M for large‑scale PV plants.

In solar operations, detecting underperformance is not just about numbers, it's about knowing where the problem lies. For Performance Engineers, O&M teams, and Asset Managers, this is critical for fast and cost-effective interventions. Delfos' Geo Heatmap transforms traditional performance analysis by adding a spatial layer, turning operational data into visual insights mapped across your PV assets.

In this article, we’ll explore how the Geo Heatmap enhances visibility, accelerates diagnostics, and drives smarter field operations.

Why Geographic Performance Analysis Matters

Photovoltaic assets can span hundreds of hectares, with performance deviations often localized to specific components or zones. Without geographic context, teams risk spending hours investigating generalized alerts without locating the true root cause.

The Geo Heatmap answers this challenge by bringing location-based intelligence to KPIs, helping teams spot shading, soiling, or equipment issues down to a string level. It's the bridge between analytics and action.

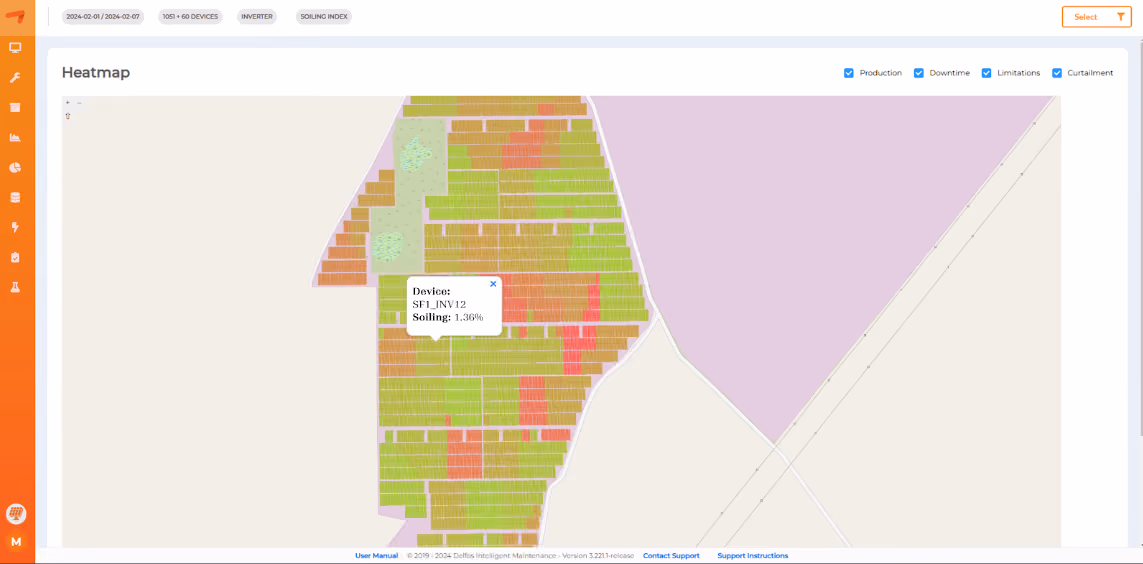
What Is the Geo Heatmap?

The Geo Heatmap is an advanced visualization feature in the Delfos Solar Platform. It overlays real-time and historical KPIs on a visual map of your PV plant, offering users a layered geographic view of asset performance.

Key Functionalities:

  • Superimposes KPIs on the plant layout
  • Drill-down analysis to:
  • Inverter level
  • String box level
  • String level
  • Color-coded performance indicators for intuitive assessment

This spatial mapping transforms how solar professionals identify, diagnose, and act on underperformance.

Snapshot of Delfos' Geo Heatmap

Business & Technical Impact

Operational Efficiency

  • Pinpoint issues faster: Locate faulty strings, shaded panels, or soiled zones in seconds.
  • Reduce response time: Field teams navigate directly to the affected area, minimizing downtime.

O&M Cost Reduction

  • Targeted cleaning & repairs: No more blanket cleaning: focus efforts where performance loss is measurable.
  • Lower travel costs: Optimize technician routing using the geographic layout.

Better Decision-Making

  • Integrate performance data with physical asset geography for high-confidence interventions.

Real-World Application

Imagine a 50 MW PV plant experiencing a drop in energy yield. Traditional analysis flags inverter 12 as underperforming, but only with the Geo Heatmap does the team discover that one string section is shaded by overgrown vegetation. With this insight, technicians are dispatched to clear the vegetation, restoring output without unnecessary equipment inspection.

This is the power of combining data + location. While many platforms offer basic layout views, Delfos delivers actionable geographic intelligence, driving faster diagnostics and field response.

From Insight to Impact

The Geo Heatmap brings clarity to complexity. By merging KPI analysis with spatial awareness, Delfos enables solar teams to see the problem, not just measure it.

If you’re ready to enhance your plant’s diagnostics and reduce O&M costs through smarter, faster decisions, it's time to see the Geo Heatmap in action.

FAQ

What is the Delfos Geo Heatmap for solar PV?
The Geo Heatmap is an advanced visualization in the Delfos Solar Platform that overlays real-time and historical KPIs onto the plant layout, turning operational data into a geographic performance map to pinpoint underperformance quickly.
Why does geospatial performance analysis matter for O&M?
PV plants span large areas and deviations are often localized. Without location context, teams chase generic alerts and miss the root cause. The Geo Heatmap links KPIs to physical location so engineers can find, prioritize, and fix issues faster.
How does the Geo Heatmap work?
It superimposes performance indicators on the site map with intuitive color coding. Users navigate the layout and drill down to confirm where losses originate and which field actions will deliver the highest impact.
What diagnostic granularity is available?
Drill-down to inverter, string box, and string level—providing the precision needed for operational decisions and targeted interventions.
Which issues can the Geo Heatmap reveal?
It helps surface localized problems such as shading (e.g., vegetation), soiling, faulty strings, and other electrical or mechanical anomalies concentrated in specific zones of the plant.
How does it reduce response time and O&M costs?
By showing exactly where to act, teams execute selective cleaning, focused inspections, and optimized routing—cutting time-to-diagnosis, travel, and maintenance costs.
When should I use the Geo Heatmap in daily operations?
Use it when alerts flag yield drops, to plan selective cleanings, confirm shading effects, prioritize string/inverter inspections, and validate recovery after corrective actions.
How is it different from a basic plant layout view?
Basic layouts show physical placement only. The Geo Heatmap adds geospatial intelligence with KPIs, colors, and drill-down—turning visualization into actionable diagnosis.
Criterion Traditional analysis Geo Heatmap (Delfos)
Spatial context Limited (no precise location) KPIs overlaid on plant layout
Granularity High-level arrays/inverters Inverter → String box → String
Diagnosis speed Lengthy investigations Locate in seconds via colors & map
O&M logistics Broad travel and cleaning Optimized routing & selective cleaning
Outcome Generic actions High-impact, lower-cost interventions
Does it combine real-time and historical KPIs?
Yes. It blends real-time and historical data so teams can spot trends, confirm recurring issues, and measure the effect of corrective actions over time.
Real-world example: how does Geo Heatmap resolve a yield drop?
In a 50 MW plant, traditional analysis flagged inverter 12. Geo Heatmap revealed a shaded string section due to overgrown vegetation. Clearing the vegetation restored output—avoiding unnecessary equipment inspections.
Who benefits most from Geo Heatmap insights?
Performance Engineers, O&M teams, and Asset Managers who need fast localization of root causes to drive confident, field-ready decisions.
How can I see the Geo Heatmap in action?
Request a live demo to understand the diagnostic gains, faster response, and O&M cost reduction in your specific operational context.

Book a meeting

Let's connect and forge new partnerships

contact us

Custom Renewable Energy Solutions

Contact us today to discuss your renewable energy needs and find the perfect solution for your business.

By clicking “Accept all cookies”, you agree to the storing of cookies on your device to enhance site navigation, analyze site usage, and assist in our marketing efforts. View our Privacy Policy for more information.