Solar Plant Energy Losses: How Delfos Enables Identification & Recovery of Lost Generation
In today’s ultra-competitive renewable energy market, every lost kilowatt-hour (kWh) translates to reduced returns and unanswered questions. For Asset Managers, Portfolio Managers, and C-level executives overseeing large-scale solar operations, the ability to quantify, understand, and act on energy losses is no longer a nice-to-have. It’s a strategic imperative.
That’s exactly what Delfos delivers with its Energy Losses feature, a powerful analytics module designed to expose underperformance, support root-cause analysis, and guide informed decisions that boost production and profitability.
Why Energy Losses Matter in Utility-Scale Solar
Despite technological advances, solar plants often fall short of their generation targets. These gaps are caused by a range of issues: equipment inefficiencies, unplanned downtimes, soiling, clipping (the energy lost when solar panels produce more power than the inverter can handle, causing the excess to be discarded), curtailments, and even data inconsistencies.
For stakeholders like the Head of Asset Management or CEO, these energy discrepancies represent invisible losses: difficult to detect, let alone resolve. Without the right visibility, teams rely on manual data exports, siloed monitoring tools, or general inverter portals that fail to reveal the true scale and source of the problem.
Introducing the Energy Losses Tool from Delfos
Delfos’ Energy Losses feature changes the game by offering two complementary modules within its Solar Platform:
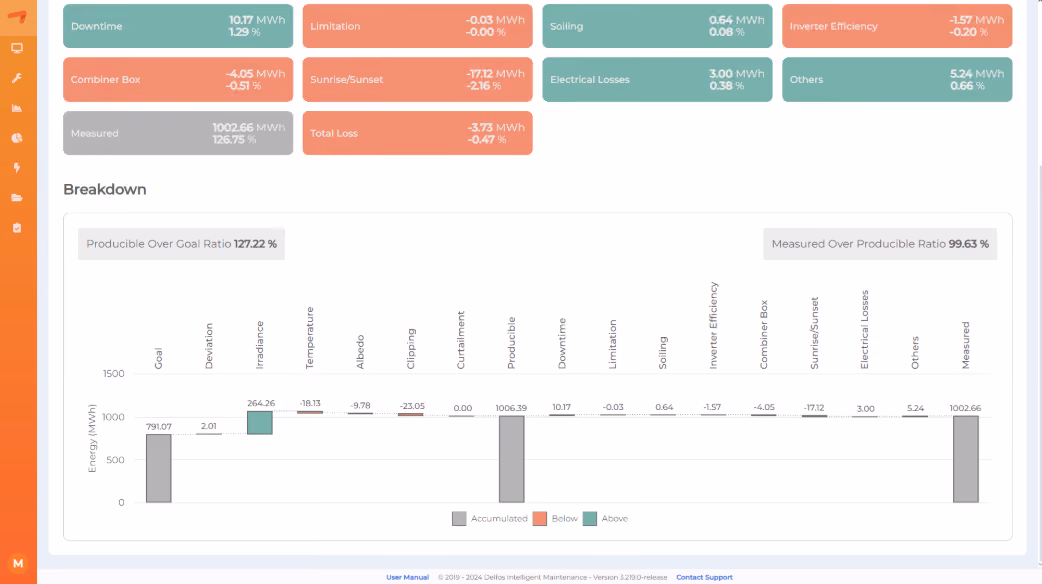
1. Breakdown View: The Big Picture
This submodule visually reconstructs your plant’s performance using a waterfall chart that compares expected vs. actual production. Key characteristics include:
- Certification Benchmarking: Compares actual output with targets based on yield assessments data.
- Categorized Losses: Visualizes each type of loss (downtime, resource underperformance, operational issues).
- Display Modes: Toggle between Simplified and Technical views depending on your operational depth.
- Baseline Selection: Use goals, producible energy, or measured energy to frame your analysis.
- Interactive Insights: Hover over any chart segment for precise details on loss categories.
This feature enables high-level executives to quickly assess whether a plant is operating at optimal efficiency and where attention is needed.
2. Loss per Equipment: Zoom into the Details
While the Breakdown view helps explain the "what" and "how much", the Loss per Equipment view answers the critical "where".
Key features include:
- Component-Level Visibility: Analyze performance losses for each plant or inverter.
- Comparative Analysis: Pinpoint which equipment is underperforming relative to its peers.
- Custom Aggregation: Group losses by inverter or plant to assess performance across clusters.
- Certifications Context: Identify whether losses exceed or fall within the acceptable deviation thresholds.
- Actionable Detail: Interactive charts reveal root causes, helping O&M teams target interventions.
This granular visibility is a must-have for Maintenance Managers aiming to align field actions with financial priorities.

The Value for Every Role
- Asset Managers: Get clear visibility into energy loss sources to better prioritize asset optimization strategies.
- Portfolio Managers: Benchmark performance across plants and make data-backed investment decisions.
- Maintenance Managers: Pinpoint faulty components and reduce diagnostic time.
- Head of Asset Management: Demonstrate operational control and boost investor confidence.
- CEOs of Renewable Portfolios: Connect technical performance to financial outcomes and improve asset ROI.
How Delfos Stands Out
Unlike general inverter portals or fragmented dashboards, Delfos integrates SCADA, BoP (beyond the inverter level), and third-party data sources to build a unified view. The Energy Losses feature is part of Delfos’ suite, which includes predictive analytics, alarm management, and smart reporting — all designed for multi-technology portfolios.
Combined with Delfos’ commitment to modular design and intuitive UX, this functionality ensures faster time-to-insight for high-stakes decisions.
From Diagnosis to Optimization
Understanding energy losses is not just about identifying underperformance, it’s about unlocking value. Delfos’ Energy Losses tool equips solar portfolio leaders with precise, data-rich insights that go beyond surface-level monitoring—transforming energy loss analysis from a reactive task into a strategic lever for performance and profitability.
Book a meeting
Let's connect and forge new partnerships


Custom Renewable Energy Solutions
Contact us today and join global operators who recovered up to 10% revenue and cut downtime by 18%