
UK Wind Curtailment: What September 2026’s Record Balancing Costs Reveal About Grid Constraints
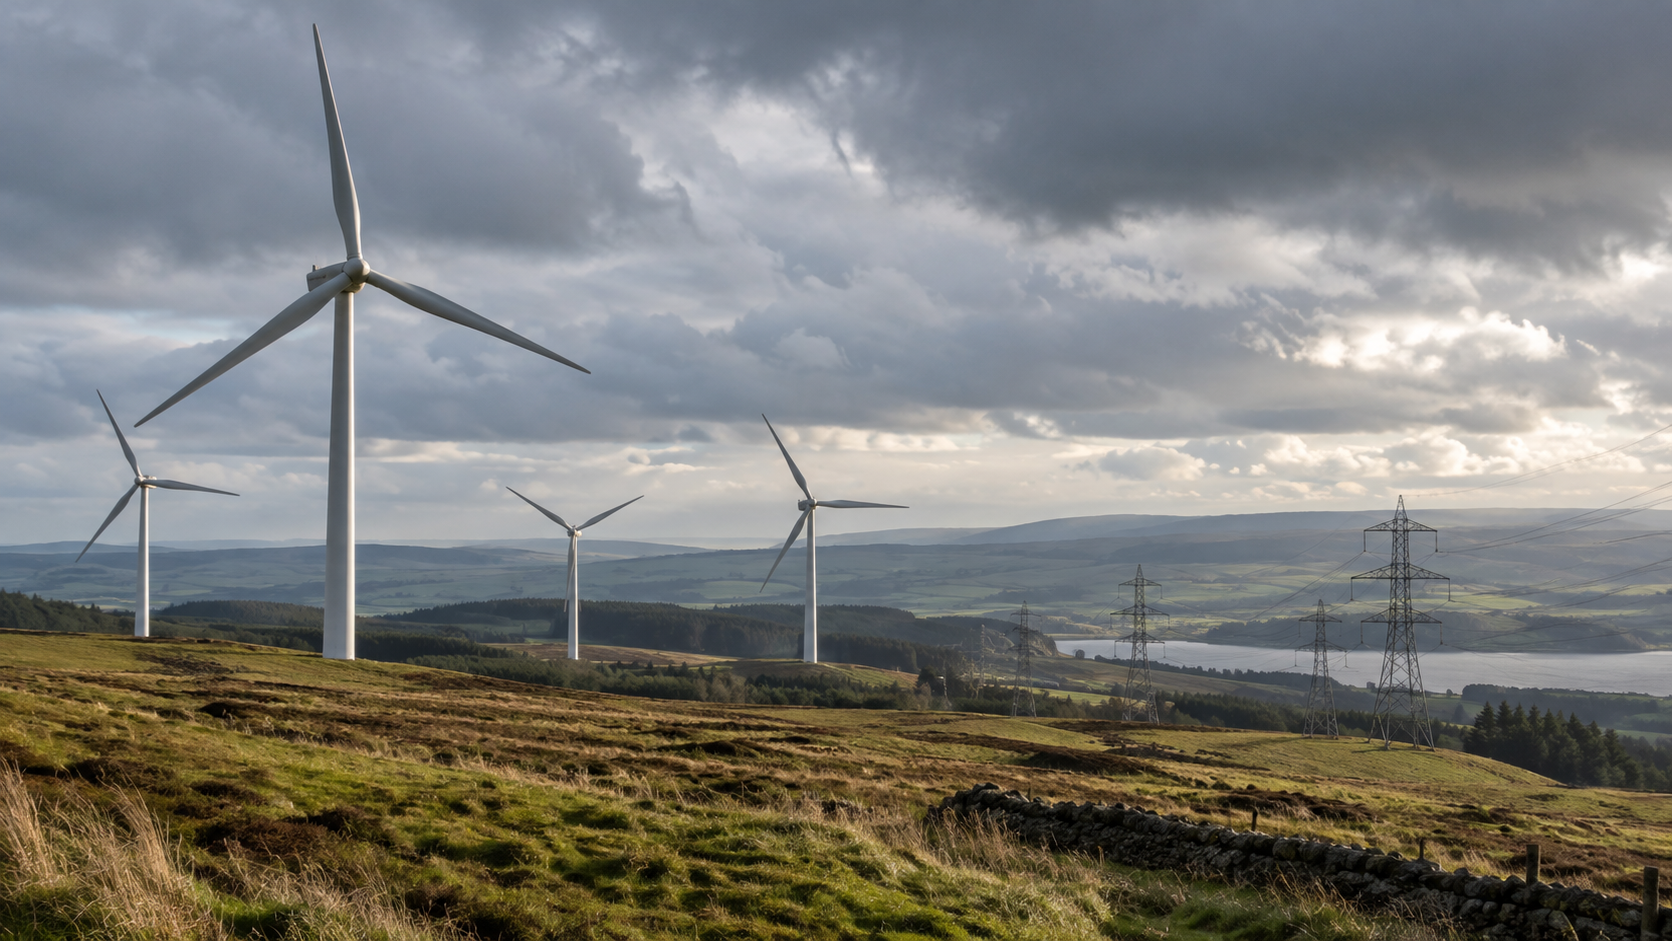
Great Britain’s transition towards a power system dominated by renewable generation is creating a new operational paradox. The country can have more than enough wind available to produce clean electricity and, at the same time, be unable to use all of it because the transmission network cannot move that power to where demand is concentrated.
That tension became particularly visible in September 2026. On 8 September, Great Britain recorded a reported £35 million in balancing costs in a single day, surpassing a £32 million record set just four days earlier. Strong winds were generating significant volumes of electricity in northern Britain, while network constraints limited how much of that power could be transported south. NESO therefore had to reduce output from some wind farms while increasing generation elsewhere to maintain a secure and balanced system. sEnergy Live News reported the £35 million figure following confirmation frodelfom NESO.
The headline number is striking, but it needs context. The £35 million represents balancing costs, not £35 million paid exclusively to wind farms for curtailment. Balancing the electricity system involves several actions, including reducing generation in constrained areas, procuring replacement electricity elsewhere and using additional balancing services to maintain system security. Understanding that distinction is essential because the economic impact of wind curtailment extends well beyond the payment made to the curtailed generator.
What is wind curtailment?
Wind curtailment occurs when a wind farm is technically capable of producing electricity but is instructed to reduce its output. Curtailment can happen for several reasons, but in Great Britain one of the most important drivers is the physical capacity of the transmission network.
A large share of Britain's wind resource is located in Scotland and northern regions, while many of the largest electricity demand centres are further south. The electricity generated in those areas must therefore travel across transmission boundaries before reaching consumers. When the volume attempting to cross a boundary exceeds what the network can safely carry, the system becomes constrained.
NESO describes these situations as thermal constraints. In practical terms, a circuit, line or other transmission asset has reached the amount of electricity it can safely transport. NESO then has to intervene, often reducing generation on one side of the constraint and increasing generation elsewhere so that supply and demand remain balanced without exceeding the network's technical limits.
This means that additional wind generation does not automatically translate into additional renewable electricity delivered to consumers. When grid capacity becomes the bottleneck, more wind can instead increase the volume of balancing actions required to operate the system securely. NESO reports that thermal constraints accounted for 61% of total balancing costs in 2025, showing how central transmission congestion has become to the economics of the British electricity system. See NESO's Electricity Markets Roadmap.
Wind curtailment is becoming a structural system challenge
The September record should not be viewed as an isolated event. NESO data shows that the volume of constraint actions increased from 11 TWh in 2024 to 14.37 TWh in 2025, while the cost of thermal constraints rose from £1.48 billion to £1.82 billion, an increase of 23%. Thermal constraints consequently increased their share of total balancing costs from 58% to 61% over the same period.
These numbers matter because they show that the challenge is developing on two fronts simultaneously. More electricity is being affected by network restrictions, and the cost of managing those restrictions is also increasing. Renewable generation capacity is expanding faster than parts of the transmission network needed to move that generation efficiently, creating periods in which Britain has sufficient electricity available but cannot transport it through the network without intervention.
The financial mechanics behind these costs are equally important. According to the UK Government's Reformed National Pricing Delivery Plan, wind generators received approximately £370 million to turn down in 2024/25, while around £910 million was spent on turn-up actions, largely involving gas generation brought online to replace constrained electricity. The latter represented roughly two-thirds of total constraint costs in that year. Read the UK Government's full analysis.
This is why describing curtailment simply as "paying wind farms not to generate" misses much of the system impact. The cost is created not only by reducing renewable generation, but also by sourcing replacement electricity and taking the additional actions required to maintain system security.
Why are UK grid constraint costs rising?
The underlying challenge is largely one of timing. New renewable generation can be developed and connected faster than major transmission infrastructure can be planned, permitted and built. As additional wind capacity enters the system, particularly in areas already rich in renewable generation, the volume of electricity attempting to cross constrained boundaries can increase before the network reinforcement needed to accommodate it is available.
The National Audit Office reported that constraint costs totalled £1.9 billion in 2025/26. It also warned that those costs could rise to as much as £7.8 billion by 2030 if grid upgrades and other measures do not progress quickly enough. The issue is therefore not whether Britain has sufficient renewable resources, but whether the surrounding infrastructure can absorb and transport that generation economically. Read the National Audit Office assessment.
For system planners, that creates an infrastructure problem. For asset managers and O&M teams, however, it creates a different challenge: when a wind farm produces less electricity than expected, teams need to know whether the loss came from the asset itself or from an external grid restriction.
What does curtailment mean for wind asset performance?
Consider a turbine operating during a period of strong wind resource. The turbine may be technically available, its components may be healthy and the environmental conditions may be sufficient for full production. If a grid instruction then requires the wind farm to reduce output, actual generation falls even though the turbine itself has not underperformed.
Without the correct operational context, that difference can distort the interpretation of asset performance. A production gap might be caused by a grid restriction, but it could also reflect technical unavailability, derating, a power-curve deviation, a component issue or another source of underperformance. In some cases, more than one cause can occur during the same period.
For asset managers, correctly separating those categories affects far more than a dashboard. It influences availability calculations, energy-loss accounting, O&M priorities, contractual discussions, revenue analysis and reporting to investors. When every MWh has a different operational and financial meaning, simply knowing that production fell is not enough.
From grid-level data to asset-level decisions
System-level data is essential for understanding when and where constraints occur. NESO publishes information on constraint actions and provides datasets that help market participants analyse transmission congestion across Great Britain. Those datasets can explain the wider system conditions surrounding an event, but they do not automatically reveal everything happening inside an individual turbine or wind farm.
That distinction becomes especially important when external and internal losses overlap. A turbine can be subject to curtailment while simultaneously developing a genuine performance issue. If teams analyse only the grid event, the technical problem may remain hidden. If they analyse only turbine production, the external restriction may be incorrectly classified as underperformance.
The more useful approach is to combine grid context with operational information such as SCADA data, expected generation, events, availability, power-curve behaviour and energy-loss calculations. This allows teams to move from a simple question, "How much generation did we lose?", towards the more operationally valuable question, "Why did we lose it, and which part can we act on?"
This is also where asset performance management becomes relevant. Delfos Energy's wind platform combines real-time monitoring with operational-event management, performance assessment, detailed loss analysis and predictive analytics. The platform's wind solution is designed to help operators identify and classify operational issues while understanding how asset behaviour affects performance across a portfolio.
For teams investigating performance at turbine level, Delfos' Asset Performance Management approach for wind energy adds another layer of analysis by identifying and prioritising underperforming turbines and supporting root-cause investigations at subsystem level.
Can Great Britain reduce wind curtailment?
There is no single intervention capable of eliminating the problem. Expanding transmission capacity remains fundamental because renewable-rich regions need stronger connections to demand centres. However, network reinforcement requires major infrastructure projects with long development cycles, meaning the power system also needs solutions that can reduce constraints before every planned transmission upgrade is completed.
Flexibility is becoming an increasingly important part of that strategy. Storage, flexible demand and improved balancing mechanisms can help the system absorb periods of abundant renewable generation rather than automatically relying on curtailment and replacement generation. NESO has been developing this approach through programmes such as the Demand Flexibility Service, which rewards consumers and businesses for adjusting electricity use in response to system needs.
From 7 October 2026, the Demand Flexibility Service is scheduled to add the capability to procure constraint-management actions, bringing functionality previously handled through the Local Constraint Market into a broader flexibility framework. NESO describes the change as part of an effort to create a simpler and more scalable route for flexibility providers to help manage both system margins and network constraints. See NESO's Demand Flexibility Service information.
The UK Government is also pursuing wider market reforms through its Reformed National Pricing programme. These measures sit alongside transmission investment and flexibility initiatives, reflecting the reality that curtailment cannot be addressed solely by adding more generation or building more lines. It requires better coordination between infrastructure, markets, storage, demand and renewable assets themselves.
What September's record really tells wind operators
The significance of September 2026 is not simply that Great Britain experienced an unusually expensive day of balancing activity. The record illustrates a broader transformation in how renewable asset performance needs to be interpreted as clean generation becomes a larger share of the electricity system.
A wind farm can maintain strong technical availability while still experiencing substantial energy losses because the network cannot accept all of its potential production. At the same time, external curtailment can make it harder to see genuine technical underperformance occurring inside the asset. This makes operational context increasingly important for teams responsible for performance, reliability and revenue.
For O&M and asset-management teams, the practical objective is therefore not to treat every lost MWh in the same way. It is to create a traceable explanation of what caused each loss, which events were external, which were technical and where action can genuinely improve performance. That level of visibility supports more accurate KPIs, more defensible reporting and better prioritisation across increasingly complex wind portfolios.
As curtailment becomes a more persistent feature of renewable operations, knowing that generation was lost will no longer be enough. The competitive advantage will increasingly come from understanding why it was lost, what it cost and what can be done next.
Book a meeting
Let's connect and forge new partnerships
Custom Renewable Energy Solutions
Contact us today and join global operators who recovered up to 10% revenue and cut downtime by 18%